This page is an example of using TablePress for your project.
Chapter 2 in the book uses K-means clustering to cluster deals sent out by a wine dealer. Here are some results obtained on using 4 clusters-
| Offer # | Offer date | Product | Minimum Qty (kg) | Discount | Origin | Past Peak | 1 | 2 | 3 | 4 |
|---|---|---|---|---|---|---|---|---|---|---|
| 1 | January | Malbec | 72 | 56 | France | FALSE | 0 | 0 | 4 | 6 |
| 2 | January | Pinot Noir | 72 | 17 | France | FALSE | 4 | 0 | 4 | 2 |
| 3 | February | Espumante | 144 | 32 | Oregon | TRUE | 0 | 0 | 2 | 4 |
| 4 | February | Champagne | 72 | 48 | France | TRUE | 0 | 0 | 7 | 5 |
| 5 | February | Cabernet Sauvignon | 144 | 44 | New Zealand | TRUE | 0 | 0 | 2 | 2 |
| 6 | March | Prosecco | 144 | 86 | Chile | FALSE | 0 | 0 | 5 | 7 |
| 7 | March | Prosecco | 6 | 40 | Australia | TRUE | 0 | 12 | 4 | 3 |
| 8 | March | Espumante | 6 | 45 | South Africa | FALSE | 0 | 11 | 6 | 3 |
| 9 | April | Chardonnay | 144 | 57 | Chile | FALSE | 0 | 0 | 7 | 3 |
| 10 | April | Prosecco | 72 | 52 | California | FALSE | 0 | 0 | 5 | 2 |
| 11 | May | Champagne | 72 | 85 | France | FALSE | 0 | 0 | 7 | 6 |
| 12 | May | Prosecco | 72 | 83 | Australia | FALSE | 0 | 0 | 3 | 2 |
| 13 | May | Merlot | 6 | 43 | Chile | FALSE | 0 | 6 | 0 | 0 |
| 14 | June | Merlot | 72 | 64 | Chile | FALSE | 0 | 0 | 5 | 4 |
| 15 | June | Cabernet Sauvignon | 144 | 19 | Italy | FALSE | 0 | 0 | 2 | 4 |
| 16 | June | Merlot | 72 | 88 | California | FALSE | 0 | 0 | 5 | 0 |
| 17 | July | Pinot Noir | 12 | 47 | Germany | FALSE | 7 | 0 | 0 | 0 |
| 18 | July | Espumante | 6 | 50 | Oregon | FALSE | 0 | 11 | 2 | 1 |
| 19 | July | Champagne | 12 | 66 | Germany | FALSE | 0 | 0 | 2 | 3 |
| 20 | August | Cabernet Sauvignon | 72 | 82 | Italy | FALSE | 0 | 0 | 4 | 2 |
| 21 | August | Champagne | 12 | 50 | California | FALSE | 0 | 0 | 2 | 2 |
| 22 | August | Champagne | 72 | 63 | France | FALSE | 0 | 0 | 0 | 21 |
| 23 | September | Chardonnay | 144 | 39 | South Africa | FALSE | 0 | 0 | 3 | 2 |
| 24 | September | Pinot Noir | 6 | 34 | Italy | FALSE | 12 | 0 | 0 | 0 |
| 25 | October | Cabernet Sauvignon | 72 | 59 | Oregon | TRUE | 0 | 0 | 3 | 3 |
| 26 | October | Pinot Noir | 144 | 83 | Australia | FALSE | 8 | 0 | 5 | 2 |
| 27 | October | Champagne | 72 | 88 | New Zealand | FALSE | 0 | 0 | 6 | 3 |
| 28 | November | Cabernet Sauvignon | 12 | 56 | France | TRUE | 0 | 0 | 4 | 2 |
| 29 | November | Pinot Grigio | 6 | 87 | France | FALSE | 0 | 15 | 2 | 0 |
| 30 | December | Malbec | 6 | 54 | France | FALSE | 0 | 16 | 2 | 4 |
| 31 | December | Champagne | 72 | 89 | France | FALSE | 0 | 0 | 10 | 7 |
| 32 | December | Cabernet Sauvignon | 72 | 45 | Germany | TRUE | 0 | 0 | 3 | 1 |
The result obtained for different clusters can be visualized.
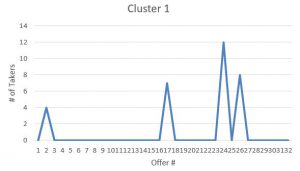
Cluster 1 has clear distinctions on what deals were chosen by customers. In this case the offer on Pinot Noir-
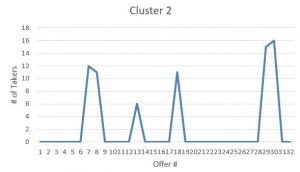
For cluster 2, some of the deals were chosen by people who could be classified as low income buyers-
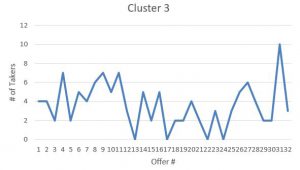
Cluster 3 is not clear and has a lot of noise-
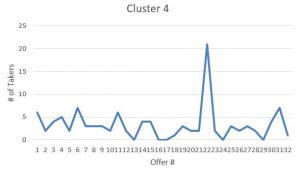
Cluster 4 shows a group of people really loved August Champaign deal. This result is quite inconclusive-